Usage
Towhee now provides a debug api for pipe to support profiling and tracing. Users can check the execution efficiency of intermediate nodes as well as their outputs by running a pipeline via debug. Also, users are allowed to specify the nodes to trace or not to trace by passing include or exclude args in debug.
example pipeline
from towhee import pipe, ops

p = (
    pipe.input('text')
        .map('text', 'emb', ops.text_embedding.data2vec())
        .output('text', 'emb')
)

v = p.debug('hello', batch=False, tracer=True, profiler=True, include=['embedding'])
v.tracer.show()
v.profiler.show()
arguments
batch: bool, whether to run in batch mode.
tracer: bool, whether to record intermediate nodes info, defaults to False.
profiler: bool, whether to record intermediate nodes efficiency, defaults to False.
include: str/list, the nodes to trace, defaults to None. If specified, only the specifed nodes will be traced.
exclude: str/list, the nodes not to trace, defaults to None.
details for include/exclude
Users are allowed to specify which nodes to include/exclude for tracing. When executing a video embedding task, the video decoder operator will output a large number of video frames, which we are not interested in, so we want to exclude them. On the other hand, sometimes we are particularly concerned about the information of a single operator and don’t care about the others, so we only want to include this operator only. Thus we provide include/exclude parameters in debug():
from towhee import pipe, ops

p = (
	pipe.input('url', 'title')
        .map('title', 'text_embedding', ops.text_embedding.data2vec())
		.flat_map('url', 'frames', ops.video_decode.ffmpeg())
		.map('frames', 'video_embedding', ops.image_embedding.timm(model_name='resnet34'))
		.output('text_embedding', 'video_embedding')
)
Exclude decode node by partial name
res = p.debug('your_video_path', tracer=True, exclude='decode')
Include embedding nodes only
res = p.debug('your_video_path', tracer=True, include=['embedding'])
Notes: Users can specify include/exclude nodes by partial names, note that all the nodes that contains the partial name will be regraded include/exclude. In the example above, we set include=['embedding'], both the text_embedding and image_embedding nodes will be traced in the pipeline.
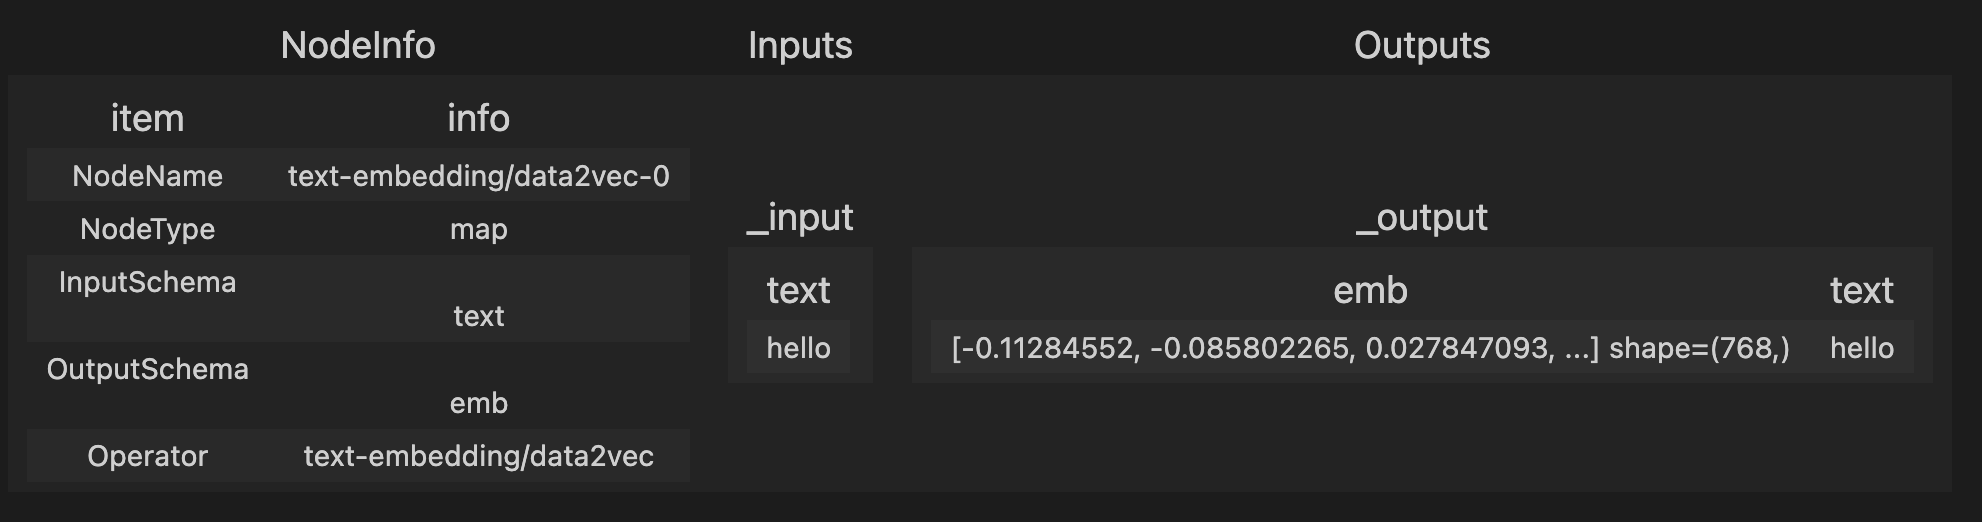
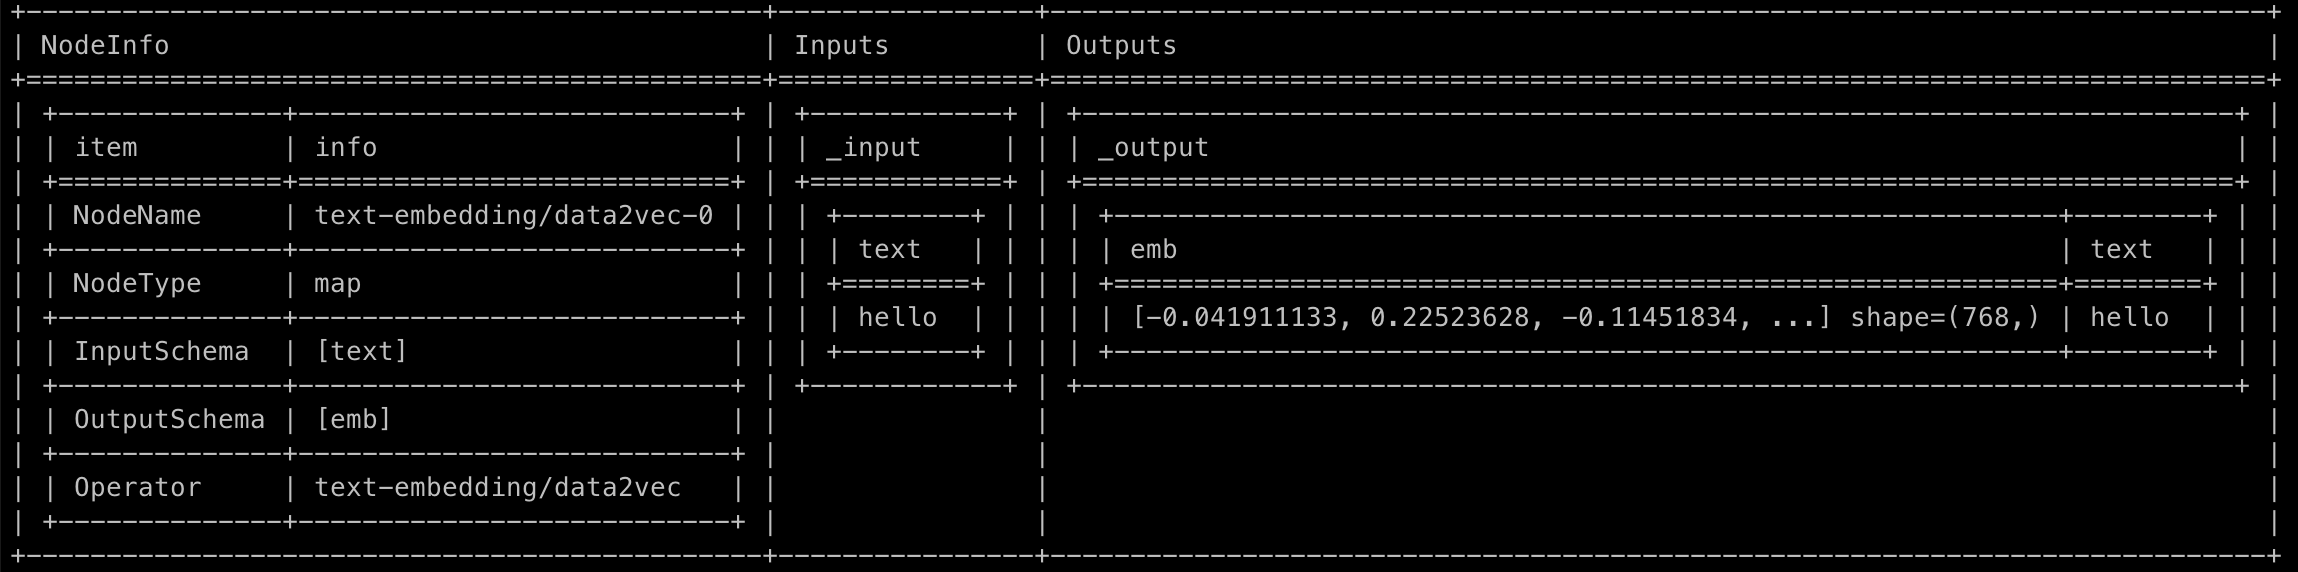
show tracer
The tracer can be showed in two format, depends on the running enviroment:
res.tracer.show()
When showed in IPython enviroment:
When showed in command lines:
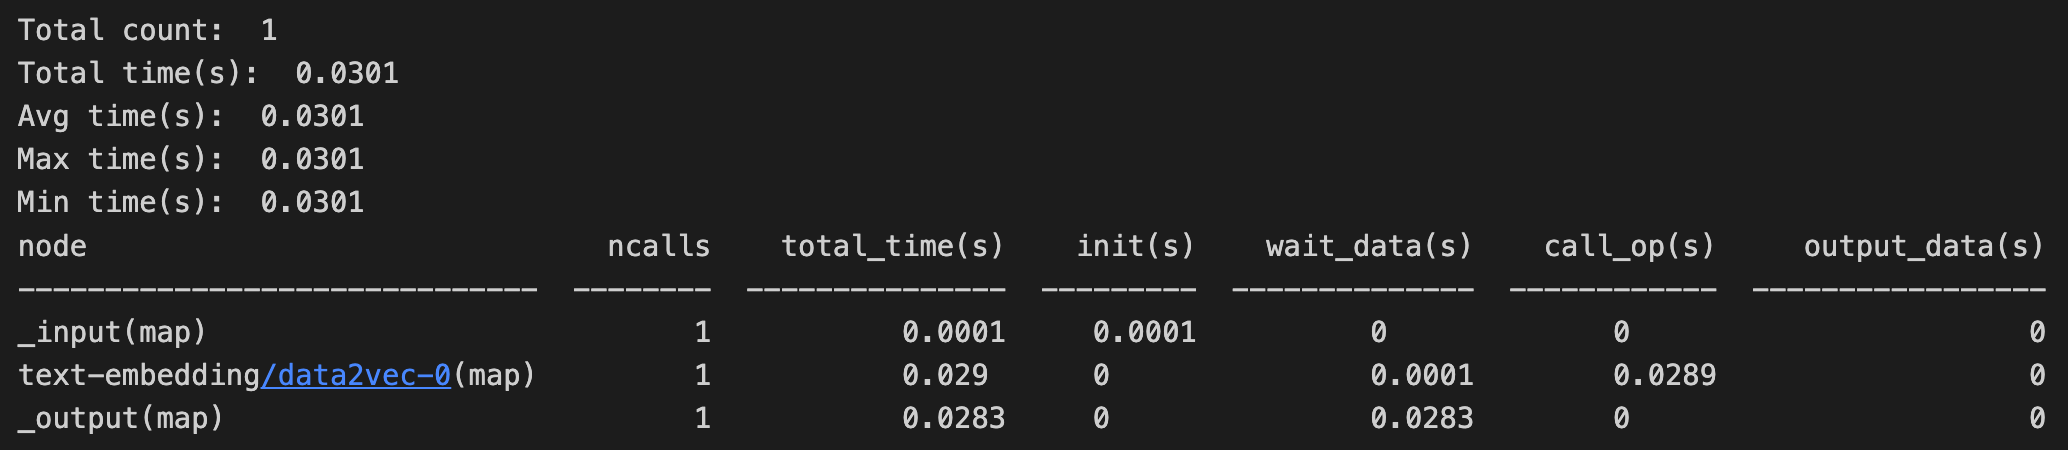
show profiler
Profiler records the performance of each node, including the total time, operator initialization time, data waiting time, operator execution time, etc…
res.profiler.show()
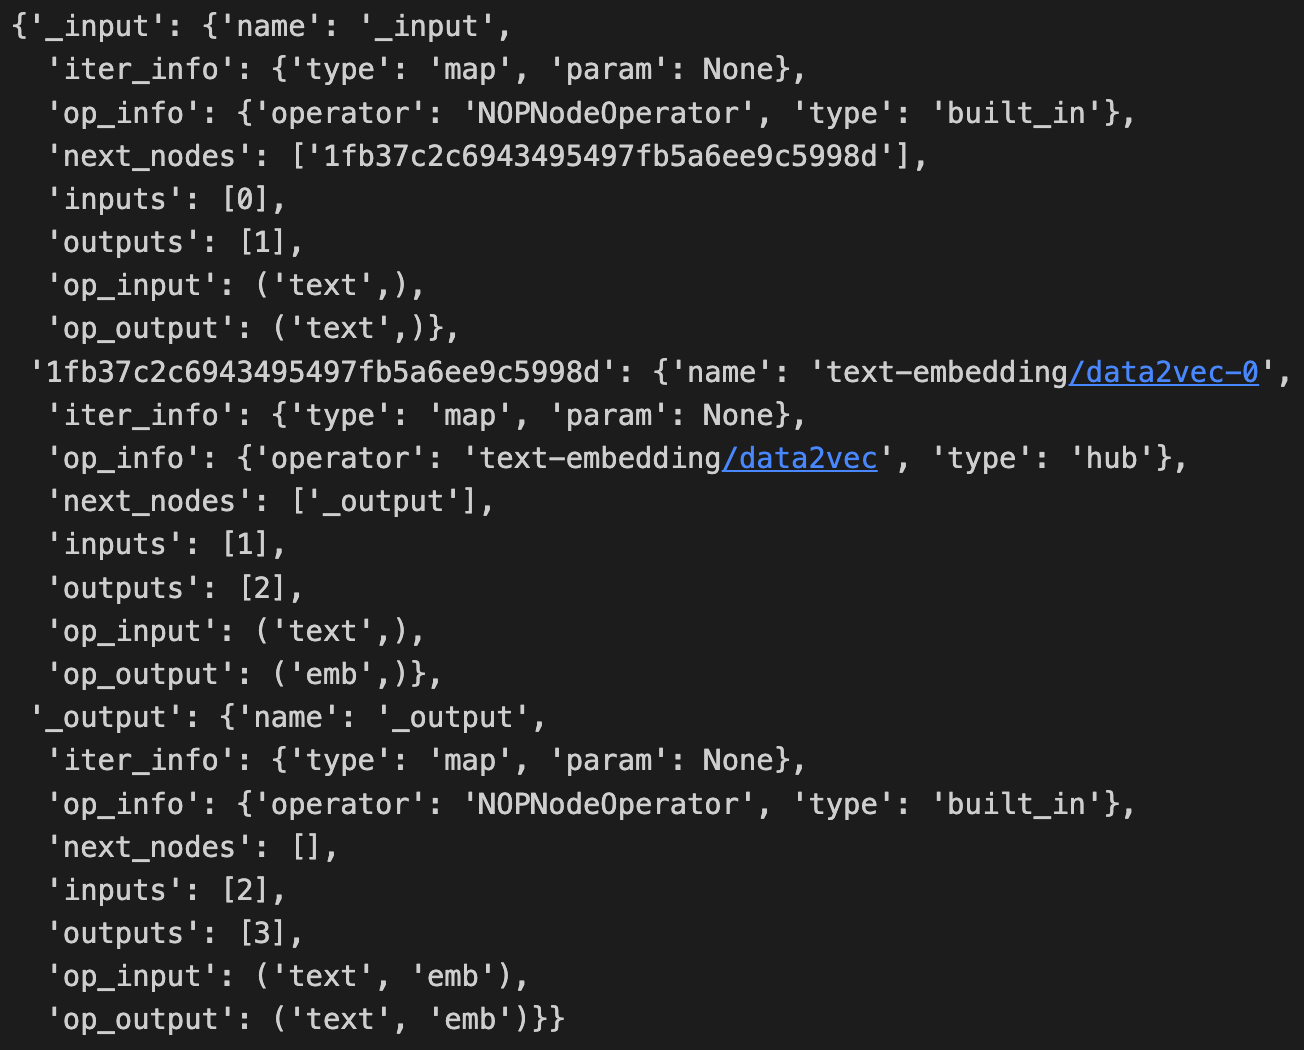
get pipeline info
Also, users can view the pipeline information in the form of a dict by property v.nodes:
res.nodes